
Disclaimer
The following content is for educational and research purposes only.
The custom injection tool and detection script (hunter.py) demonstrated in this article are Proof-of-Concept (PoC) code designed to illustrate the mechanics of Windows API abuse and memory forensics. These tools are not intended for offensive use, malicious operations, or production deployment. The detection logic provided is experimental, may generate false positives, and has not been optimized for stability in enterprise environments.
Source Code: Maxwell-Blueteam25/Thread-Injection-Hunter
What Is Process Injection?
Process injection is the act of forcing running code into the address space of a separate, live process.
In simple terms, it allows an attacker to run arbitrary commands while hiding inside a legitimate application. Instead of running a suspicious file named malware.exe, the attacker instructs a trusted target process, like Notepad.exe or svchost.exe, to allocate memory and execute a payload via standard API calls.
Why Attackers Use It
The primary goal is camouflage and privilege inheritance.
-
Evasion: Security tools often trust signed Microsoft binaries. By hiding inside one, the malicious code blends in with normal system activity.
-
Access Rights: Injected code executes under the context of the host process. It inherits all the access rights, permissions, and “trust level” of that process. If an attacker injects code into a process running with SYSTEM privileges, their code effectively becomes SYSTEM.
The Mechanics
While there are many specific techniques like Classic DLL Injection or Process Hollowing, most rely on the same fundamental logic.
To force a legitimate process to execute arbitrary code, you generally must complete four specific actions, which we call the Four Pillars of Injection:
-
Open the target.
-
Allocate memory inside it.
-
Write the payload.
-
Execute the trigger.
To understand the threat, we will build it. This article covers the creation of a process injection tool, followed by the development of a counter-script to detect it on the endpoint and in the logs.
The Four Pillars of Injection
Before we look at the Python script, you need to understand the mechanics.
Process injection almost always relies on the same four-step sequence. We are essentially hijacking a running process and forcing it to execute our code.
To do that, we need four specific Windows API calls.
1. Open (OpenProcess) You cannot modify a process you cannot touch. We first need to get a “handle” to the target process (like Notepad). This handle must have specific permissions, explicitly granting us the right to write data into its memory.
2. Allocate (VirtualAllocEx) Code needs physical space to exist. Once we have the handle, we have to carve out a chunk of empty memory inside the target process. We use this function to reserve a region of memory large enough to hold our payload (in this case, the file path to our DLL).
3. Write (WriteProcessMemory) Allocation just gives us an empty box; now we have to fill it. We take our payload from our script and copy it bit-for-bit into the newly allocated memory space of the target.
4. Execute (CreateRemoteThread) The code is now inside the target, but it’s sitting dormant. We need a trigger. This function spawns a new thread within the target process. We point that thread’s “start address” to the memory region we just wrote to, effectively tricking the CPU into running our code as if it were a legitimate part of the application.
Building the Injection Script
We will build this tool using Python’s ctypes library, which allows us to interact directly with kernel32.dll and the Windows API.
1. Opening the Target (OpenProcess)
The first requirement for injection is obtaining a handle to the victim process. A handle is essentially a permission slip from the OS kernel allowing us to modify a running application.
We achieve this with the OpenProcess function.
The Syntax
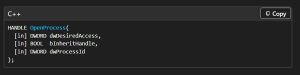
The Arguments

-
dwDesiredAccess(PROCESS_ALL_ACCESS): This argument dictates the level of control we are requesting. We passedPROCESS_ALL_ACCESS, which grants read, write, and terminate permissions.-
Note: In a real-world scenario, requesting “All Access” is loud and often flagged by EDRs. Advanced attackers will request only the minimum necessary flags (like
PROCESS_VM_WRITEandPROCESS_VM_OPERATION). We useALL_ACCESShere to ensure the lab functions without permission errors.
-
-
bInheritHandle(False): This boolean value determines scope. By setting it toFalse, we ensure that if our script spawns any child processes, they do not inherit this handle. This keeps the interaction contained strictly between our script and the target. -
dwProcessId(pid): The integer ID of the target (e.g., Notepad). This tells the kernel exactly which process memory space we intend to violate.
If successful, the function returns a Handle (h_process).
2. Allocating Memory (VirtualAllocEx)
Now that we have the handle (the ticket), we have permission to touch the target. But we cannot simply write data yet.
The Problem: Virtual Memory Isolation Every process in Windows lives in its own “Virtual Reality.”
-
Notepad thinks it owns memory addresses
0x000000to0xFFFFFF. -
Our Python Script thinks it owns
0x000000to0xFFFFFF.
If you write to address 0x1234 in your Python script, that data stays in Python’s memory. It does not magically appear in Notepad. To put data into Notepad’s world, we must explicitly allocate new space inside their reality.
We do this using VirtualAllocEx.
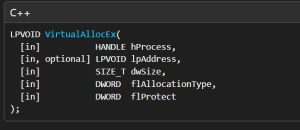
The Arguments
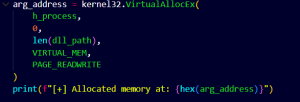
-
hProcess: The handle we acquired in Step 1. This tells Windows which process’s “reality” we are modifying. -
lpAddress(0): We pass0(NULL) here. This tells Windows: “I don’t care where in Notepad’s memory you put this. Find a free spot and tell me the address”. -
dwSize(len(dll_path)): We are not injecting the DLL file itself yet; we are injecting the file path to the DLL. We request exactly enough bytes to hold that string. -
flAllocationType(VIRTUAL_MEM): We combineMEM_RESERVEandMEM_COMMIT.-
Reserve: Tells the OS to mark this address range as “taken” so nothing else overwrites it.
-
Commit: Actually allocates the physical RAM backing it so we can write data there.
-
-
flProtect(PAGE_READWRITE): We needReadaccess (so the target can read the path later) andWriteaccess (so we can write the path now).
VirtualAllocEx returns an integer. This is the memory address inside Notepad where our reserved space lives.
However, we hit the isolation problem again: Python cannot read or write to this address directly because that address exists in a different virtual memory space. To bridge that gap, we need the next function.
3. The Courier (WriteProcessMemory)
We have the address in Notepad, and we have the data in Python. Now we ship it.
VirtualAllocEx creates a writable memory region inside the target process. WriteProcessMemory copies data into that region.
The Syntax
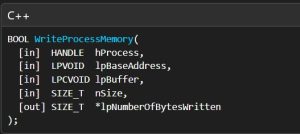
The Arguments
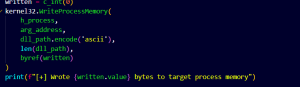
-
hProcess: The same handle (ticket) we’ve been using. -
lpBaseAddress(arg_address): This is the destination. We pass the memory address returned byVirtualAllocExin the previous step. -
lpBuffer(dll_path.encode('ascii')): This is the payload.-
Critical Note: Windows APIs are written in C/C++. They do not understand Python strings. You must encode the string into raw bytes (ASCII or UTF-8) before sending it. If you send a standard Python string, the injection will fail because the API will read the internal Python object structure instead of the text characters.
-
-
nSize(len(dll_path)): The exact number of bytes to write. -
lpNumberOfBytesWritten(byref(written)): A pointer to a variable where Windows will report back how much data it actually moved. This is useful for error checking—if you tried to write 50 bytes and this returns 0, something broke.
The file path to our DLL is now physically sitting inside Notepad’s memory. It is no longer just a variable in our Python script; it is part of the target process’s “virtual reality.”
However, Notepad doesn’t know it’s there yet. It’s just data sitting in a random memory address. We need to force Notepad to execute it.
4. The Trigger (CreateRemoteThread)
The payload is sitting in the target’s memory, but it is dormant. It’s just text bytes sitting in a random address. We need to tell the processor to execute it.
This is where we use CreateRemoteThread.
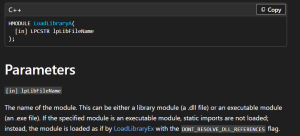
LoadLibraryA: We aren’t creating a thread to run our custom shellcode directly. We are tricking the target process into running a standard Windows function: LoadLibraryA.
-
The Function:
LoadLibraryAis built into Windows. Its only job is to load a DLL into a process. -
The Argument: It requires exactly one argument: a pointer to a string containing a file path.
This creates the perfect match. In Step 3, we wrote a file path into memory. Now, we spawn a thread that runs LoadLibraryA and points it to that memory address.
The Syntax
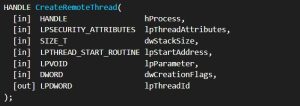
The Arguments
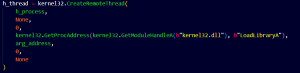
-
hProcess: The handle (ticket) to the target. -
lpStartAddress: The function to run. We useGetProcAddressto find the exact memory address ofLoadLibraryAinsidekernel32.dll. -
lpParameter(arg_address): The argument passed to the function. This is the memory address we got fromVirtualAllocEx(Step 2), which contains our DLL path.
The Result
-
Windows creates a new thread inside Notepad.
-
That thread executes
LoadLibraryA. -
LoadLibraryAgoes to the address we provided, reads the file path, and loads our malicious DLL. -
The DLL’s
DllMainfunction fires immediately. Code execution is achieved.
Detecting Process Injection
Detection relies on identifying inconsistencies between expected application behavior and actual memory execution. Because the malicious code runs inside a trusted process, traditional signature-based antivirus often fails to spot the intrusion.
To detect this, we must look for two specific categories of indicators: Behavioral Anomalies and Memory Artifacts.
1. Behavioral Anomalies
This method focuses on identifying “Trusted Processes” acting in untrusted ways. Red Canary and SentinelOne highlight that while the injection itself might be stealthy, the actions taken by the injected code often generate noise.
-
Unexpected Parent-Child Relationships: Legitimate programs follow predictable hierarchies. For example,
explorer.execommonly spawnsnotepad.exe. However, ifnotepad.exespawnscmd.exeorpowershell.exe, this is a high-probability indicator of compromise. -
Anomalous Network Activity: Injected processes often establish Command and Control (C2) connections. A process like
calc.exeornotepad.exeinitiating an outbound network connection—especially to an external IP—is a standard behavioral red flag.
2. Memory Artifacts
This method involves scanning the live RAM to find code that does not belong.
When a legitimate program loads a DLL, that memory is “backed” by a file on the disk (e.g., kernel32.dll). The OS knows exactly which file corresponds to that memory address. In contrast, injected code is often “Floating Code”.
-
Private, RWX Memory: In our injection attack, we used
VirtualAllocExto carve out raw memory. This creates a memory region marked asMEM_PRIVATE(not backed by a file on disk) with permissions set toPAGE_EXECUTE_READWRITE(RWX). -
The Artifact: Security researchers at Black Lantern Security note that searching for these specific memory permissions—executable code that exists only in memory and not on disk—is a primary method for detecting fileless malware.
Developing a Targeted Detection Tool
We developed a specialized educational script designed to hunt for the specific Classic DLL Injection technique we demonstrated in Part 1. Instead of scanning all memory, this tool inspects the Thread Start Address of every running process.
Specifically, it looks for a distinct heuristic: a thread that begins execution exactly at the memory address of LoadLibraryA.
Building the Detection Script: Part 1
We will break down the detection script into two sections: accessing the kernel data and applying the detection logic.
Disclaimer The “Thread Injection Hunter” script provided in this article is strictly for educational purposes. It is designed to illustrate the mechanical artifacts of the CreateRemoteThread technique in a controlled lab environment. In a production network, this script lacks the exception handling, performance optimization, and whitelisting necessary to avoid false positives.
Accessing Undocumented APIs
Python’s standard libraries (like psutil) can list threads, but they cannot tell you where a thread begins in memory. To get that data, we must bypass standard libraries and speak directly to the Windows Kernel (ntdll.dll) using an undocumented API called NtQueryInformationThread.
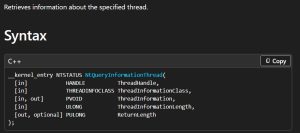
Note: Although NtQueryInformationThread now appears in Microsoft headers, it remains undocumented for standard application development and requires manual definition when used from Python or other non-native environments.
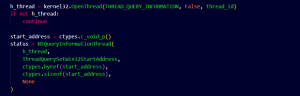
The Syntax
-
NtQueryInformationThread: This is the core of the script. It allows us to query low-level attributes of a thread handle. By passing the argument9(ThreadQuerySetWin32StartAddress), we request the memory address where the thread began execution. -
address_of_load_lib: This is our reference point. In our Injection script, the attacker forces the new thread to start atLoadLibraryA. Becausekernel32.dllis loaded at the same virtual address in almost every process, the address in our script matches the address in the victim process. -
OpenThread: Just likeOpenProcess, we need a handle. We requestTHREAD_QUERY_INFORMATION(0x40), a low-privilege request.
Building the Detection Script: Part 2
Once we have the thread’s start address, we simply compare it against our known “evil” address.
The Logic & Alerting
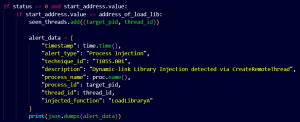
A match between the thread start address and LoadLibraryA is an anomaly. While not theoretically impossible, it is unusual for legitimate applications to initiate threads directly at this function.
-
The Signature Match: The line
if start_address.value == address_of_load_libis the filter. It ignores the millions of legitimate threads running on the system and only flags the specific anomaly we created in Part 1. -
SIEM-Ready Output: We generate a JSON object containing the timestamp, Technique ID (T1055.001), and the specific process details. This allows a SIEM (like Splunk or Elastic) to automatically parse the alert without complex regex.
Other Detection Strategies (SIEM & Logs)
While our script demonstrates active hunting, production detection relies on log correlation. You shouldn’t be looking for a single event. Rather, you should be looking for a sequence of behavior.
The “Injection Triad” According to MITRE Detection Strategy DET0389, high-fidelity detection comes from spotting the “Allocate, Write, Execute” chain. We monitor for a process that requests memory in a remote target (VirtualAllocEx), pushes data into it (WriteProcessMemory), and immediately forces that target to spawn a new thread (CreateRemoteThread).
Key Sysmon Indicators To alert on this in Splunk or Elastic, correlate these events:
-
Event ID 10 (Process Access): Catches the initial “handle request” (e.g.,
PROCESS_VM_WRITE). -
Event ID 7 (Module Load): Triggers when the target actually loads the suspicious DLL.
-
Event ID 1 (Process Creation): vital for spotting odd parent-child relationships (like Word spawning PowerShell).
For a deeper dive into these telemetry points, read the Red Canary Threat Detection Report on Process Injection.
Conclusion
MITRE ATT&CK classifies Process Injection (T1055) as a defense evasion and privilege escalation technique where code is concealed within the address space of a separate process. As noted in the Red Canary Threat Detection Report, this technique remains a prevalent method for adversaries to bypass security controls and mask activity under legitimate system binaries.
The technical execution follows the “Allocate-Write-Execute” pattern documented in MITRE Detection Strategy DET0389. This sequence requires specific Windows API calls: OpenProcess to gain access, VirtualAllocEx to reserve memory, WriteProcessMemory to inject the payload, and CreateRemoteThread to initiate execution.
Detection requires correlating memory analysis with behavioral monitoring.
-
Memory Artifacts: Black Lantern Security identifies
MEM_PRIVATEmemory regions withPAGE_EXECUTE_READWRITE(RWX) protection as high-fidelity indicators of injected code. -
Thread Anomalies: In the specific case of Classic DLL Injection, the created thread initiates execution at the address of
LoadLibraryA, a heuristic distinct from standard thread creation. -
Behavioral Indicators: Red Canary advises monitoring for deviations in process behavior, specifically unexpected parent-child relationships (e.g.,
notepad.exespawning shells) and anomalous network connections from trusted processes.
Effective identification relies on validating these memory attributes and correlating API sequences via telemetry sources such as Sysmon, rather than relying on file-based signatures.
Sources
Windows API Documentation (Microsoft Learn)
Threat Research & Detection
MITRE ATT&CK Framework